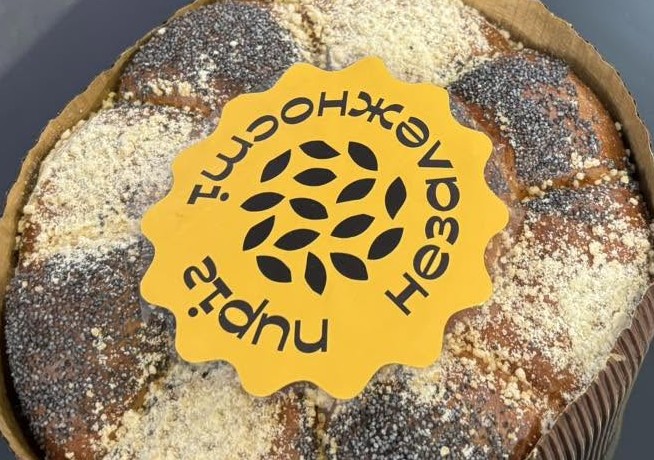
Every nation has recipes that are passed down from generation to generation. Tastes, eating habits and attitudes towards food change over time, yet some dishes remain a constant, continuing to bring together people of different ages. For Ukrainians, pie is one such dish: 35% of respondents eat pies several times a month, 16% about once a month, and 38% less than once a month, according to a Gradus survey conducted alongside the national My Independence Pie competition, which brings together stories about Ukrainian culinary traditions, regional flavours and home baking.
Ukrainians Love Eating Pies — Baking Them, Not So Much
When choosing between a sweet and savoury pie, sweet is the clear favourite: 50% of respondents prefer it. Another 33% say their choice depends on the situation, while 18% prefer savoury pies.
However, Ukrainians enjoy eating pies far more than making them. As many as 83% prefer eating pies, while only 13% are willing to bake them themselves.
The title of chief pie-maker still belongs to Mum. Some 38% of Ukrainians surveyed say their mother’s pies are the tastiest. Homemade pies baked by respondents themselves and pies made by grandmothers received 18% each, while 16% chose pies from bakeries or shops.
Favourite Fillings and Drinks to Pair with Pie
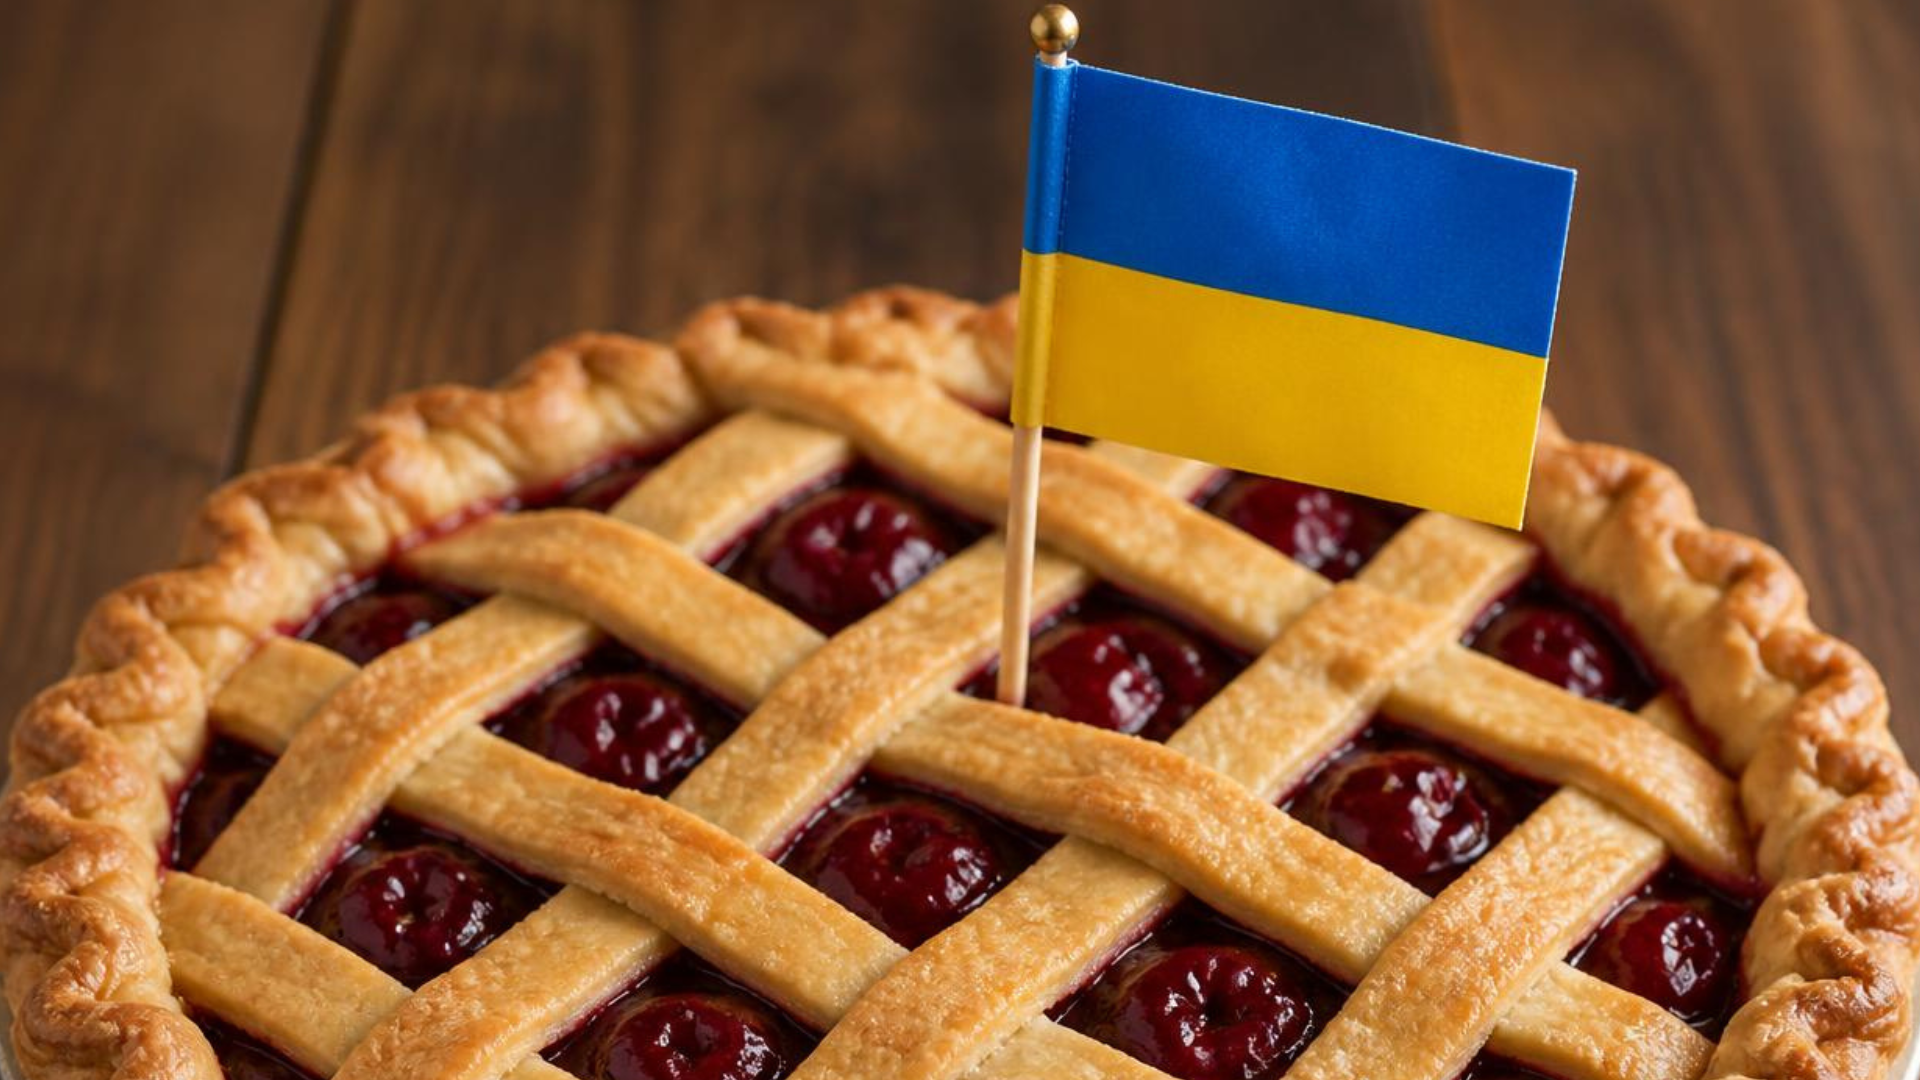
There is also a clear favourite among fillings. Cherry tops the list, followed by meat and apple pies, with cheese and poppy seed fillings in third place. Fish, meanwhile, remains a much less popular choice for pie filling.
And finally, the perfect companion to a slice of pie is a hot drink. Tea is the most popular choice (28%), while coffee and milk each received 16%, and compote 12%.
It seems the recipe for a Ukrainian Independence Pie is quite simple: a little cherry, plenty of homemade warmth, and a cup of tea on the side.
The survey was conducted by Gradus using a self-administered questionnaire in the Gradus mobile application. The sample reflects the population structure of cities with more than 50,000 residents aged 18–60, excluding temporarily occupied territories and areas of active hostilities. Fieldwork was conducted on 6–7 August 2026. Sample size: 1,000 respondents.