The results of the new study “Media Consumption 2025” demonstrate how the habits of Ukrainians in the digital space are changing. The main conclusion is that the smartphone has finally become the primary screen in people’s lives, and media increasingly plays the role of a background for daily activities.
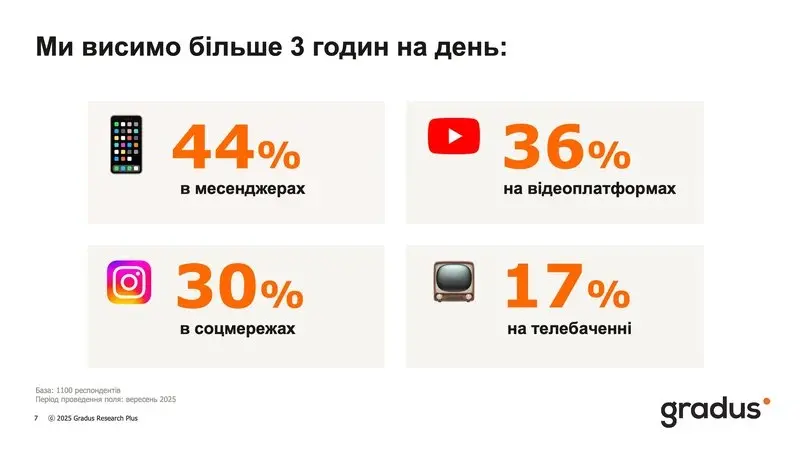
Ukrainians are spending more and more time online: 44% admit to being in messengers for more than three hours every day, 36% spend the same amount of time on video platforms, 30% — on social networks, while television remains important for only 17% of the audience. Almost everyone — 91% — consumes content specifically from a smartphone, and this trend has no age exceptions. The mobile device has turned into a universal media center — a channel for news, entertainment, and communication simultaneously.
We are hooked for more than 3 hours a day:
What Ukrainians choose: humor, sports and podcasts
In 2025, Ukrainians are increasingly choosing lighter and more dynamic content. Humorous shows and stand-ups have become more popular — the audience for such formats grew from 49% to 54%. Interest in sports programs rose from 31% to 35%, and 29% of respondents already listen to podcasts — six percentage points more than last year.
Telegram and video platforms are the main influence channels
Messengers remain the main channel for news consumption: 75% of Ukrainians receive information via Telegram, Viber and other services. Their popularity is not growing, but remains at a consistently high level — this indicates an established habit of learning about events in the format of short, personalized messages.
Channels for news content consumption
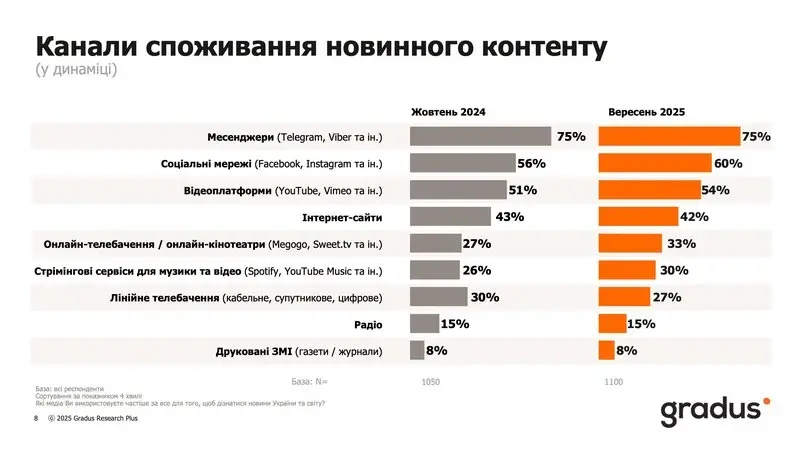
Social networks are strengthening their position in informing — 60% of respondents use Facebook, Instagram or other platforms to get news (compared to 56% last year). At the same time, video platforms such as YouTube, Vimeo, etc., increased their share from 51% to 54% — video content continues to become the main source of information, especially among the younger audience.
Internet websites remain in the zone of stability (42%), while linear television lost another three points over the year and stands at 27%. This indicates a long-term trend of shifting trust and attention toward digital channels.
Entertainment content becomes a universal language of communication
When it comes to rest and entertainment, the dominance of video platforms is even more obvious: 61% of Ukrainians name YouTube as the main place for leisure. It is followed by social networks (58%) and messengers (53%). The dynamics of the last two years show that messengers effectively perform the function of a personal media hub — a space where news, humor, music, analytics and private communication are combined.
Channels for entertainment content consumption
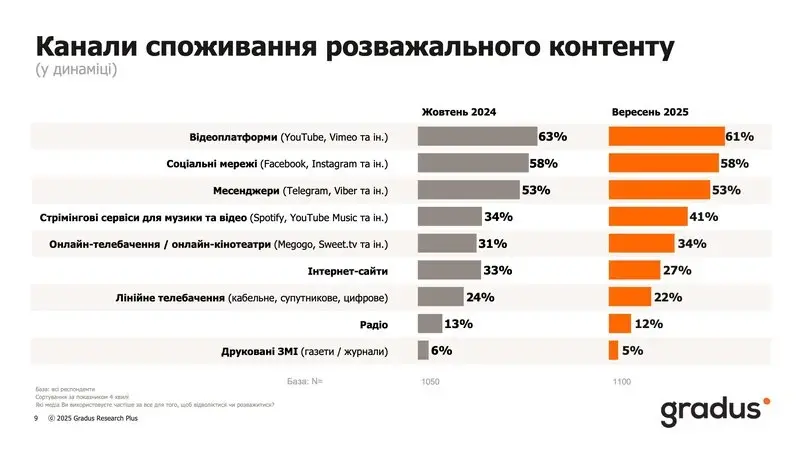
Interest in streaming services for music and video is growing: 41% use Spotify or YouTube Music, which is seven points more than last year. Online cinemas are also gradually expanding their audience — from 31% to 34%. This indicates the maturation of the Ukrainian user towards paid, high-quality content.
Telegram strengthens leadership, WhatsApp gains weight
Telegram remains the undisputed leader among messengers — 92% of users use it weekly, and this figure continues to grow. Viber holds the second position, while Facebook Messenger recovered its share after a drop last year. At the same time, WhatsApp shows the largest increase — from 30% to 41% per year.
Instagram is growing, TikTok is second in terms of growth rate
Among social networks, the top positions are stable: Facebook remains the main platform for 72% of users, but Instagram continues to build its audience — 67% (plus 6 p.p. per year). The most noticeable growth is shown by TikTok — from 49% to 54%. This network is increasingly used not only for entertainment but also for receiving news, especially among the younger audience.
Pinterest is also growing, which indicates an expansion of niche visual content. LinkedIn increased its presence to 7%, reflecting Ukrainians’ interest in professional communities and career development in digital.
Media consumption has become a reflection of our lifestyle. We strive to stay informed, but at the same time, we seek relief from information noise. This is a balance between control and fatigue: people simultaneously strive for proximity to events and distance from them, creating a new culture of attention,
— says Evheniya Blyznyuk, founder and CEO of Gradus.
The study was conducted by the research company Gradus using the method of self-completion of the questionnaire in the Gradus mobile application. The sample reflects the structure of the population of cities with more than 50,000 inhabitants aged 18-60 by gender, age, size of the settlement and region, with the exception of temporarily occupied territories and territories of active hostilities. Fieldwork period: September 15-17, 2025. Sample size: 1100 respondents.
The research report is available on a commercial basis upon request at dn@gradus.app
For purchasers of the “Media Consumption 2024” report, a 20% discount applies to the new wave.
Report structure:
- Consumption of media content categories: feature films and series, news or socio-political programs, etc. (by gender and age);
- Channels for consuming news media content: messengers, social networks, etc. (by gender and age);
- Channels for consuming entertainment media content: messengers, social networks, etc. (by gender and age);
- Technical devices used for viewing content (by age; dynamics March 2023 – September 2025);
- Presence of a TV and the purpose of its use (by gender and age);
- Use of messengers (by gender, age, regional breakdown and settlement size; in dynamics (March 2023 – September 2025);
- Use of social networks (by gender, age, regional breakdown and settlement size; in dynamics March 2023 – September 2025);
- Use of video platforms (by age and regional breakdown);
- Watching the national telethon “United News” (without breakdown, total);
- Frequency of watching the national telethon “United News” (by gender and age);
- Watching TV channels (by gender and age and by settlement size);
- Listening to radio stations (by gender, age, regional breakdown and settlement size);
- Use of streaming services for music and video (by gender, age and regional breakdown);
- Consumption of OTT / IPTV services (by gender and age);
- Availability of a paid subscription to OTT / IPTV services and YouTube (by gender and age);
- Frequency of using media content as a background while performing other activities (by age);
- Average time of consuming content from social networks per day (by gender and age);
- Average time of consuming content from messengers per day (by gender and age);
- Average time of consuming content from video platforms per day (by age);
- Average time of consuming content from online cinema services per day (by gender and age);
- Average time of consuming content from internet sites per day (by gender and age);
- Average time of consuming content from Ukrainian TV channels per day (by age);
- Average time of consuming content from podcasts per day (by age);
- Average time of consuming content from radio per day (by gender and age);
- Circumstances of audio content consumption (by gender and age);
- Use of services for blocking ads on the Internet (by gender and age);
- Sample structure.
Want to see the bigger picture?
The “Media Consumption 2025” report provides a deep understanding of today’s trends, but the world changes every day. To always stay up to date with public sentiments and consumer behavior — sign up for a Gradus Subscription.
A subscription is more profitable than individual reports:
- Annual access to systematic monitoring of trends;
- Relevant insights immediately after data updates;
- The ability to choose one of the ready-made packages or form your own list of reports with a discount.
Pay less — get more insights.
You can purchase the “Media Consumption 2025” report or set up a Gradus Subscription upon request to the email dn@gradus.app